

t-SNE
Overview
t-Distributed Stochastic Neighbor Embedding (t-SNE) is a technique for dimensionality reduction that is particularly well suited for the visualization of high-dimensional datasets. The technique can be implemented via Barnes-Hut approximations, allowing it to be applied on large real-world datasets. We applied it on data sets with up to 30 million examples. The technique and its variants are introduced in the following papers:
- L.J.P. van der Maaten. Accelerating t-SNE using Tree-Based Algorithms. Journal of Machine Learning Research 15(Oct):3221-3245, 2014. PDF [Supplemental material]
- L.J.P. van der Maaten and G.E. Hinton. Visualizing Non-Metric Similarities in Multiple Maps. Machine Learning 87(1):33-55, 2012. PDF
- L.J.P. van der Maaten. Learning a Parametric Embedding by Preserving Local Structure. In Proceedings of the Twelfth International Conference on Artificial Intelligence & Statistics (AI-STATS), JMLR W&CP 5:384-391, 2009. PDF
- L.J.P. van der Maaten and G.E. Hinton. Visualizing High-Dimensional Data Using t-SNE. Journal of Machine Learning Research 9(Nov):2579-2605, 2008. PDF [Supplemental material] [Talk]
An accessible introduction to t-SNE and its variants is given in this Google Techtalk.
Implementations
Below, implementations of t-SNE in various languages are available for download. Some of these implementations were developed by me, and some by other contributors. For the standard t-SNE method, implementations in Matlab, C++, CUDA, Python, Torch, R, Julia, and JavaScript are available. In addition, we provide a Matlab implementation of parametric t-SNE (described here). Finally, we provide a Barnes-Hut implementation of t-SNE (described here), which is the fastest t-SNE implementation to date, and which scales much better to big data sets.
You are free to use, modify, or redistribute this software in any way you want, but only for non-commercial purposes. The use of the software is at your own risk; the authors are not responsible for any damage as a result from errors in the software.
NOTE: t-SNE is now built-in functionality in Matlab and in SPSS!
| Matlab implementation (user guide) | All platforms |
| CUDA implementation (by David, Roshan, and Forrest; see paper) | All platforms |
| Python implementation | All platforms |
| C# implementation (by James) | All platforms |
| Go implementation (by Daniel Salvadori) | All platforms |
| Torch implementation | All platforms |
| Julia implementation (by Leif Jonsson) | All platforms |
| Java implementation (by Leif Jonsson) | All platforms |
| R implementation (by Justin) | All platforms |
| JavaScript implementation (by Andrej; online demonstration) | All platforms |
| Parametric t-SNE (outdated; see here) | All platforms |
| Barnes-Hut t-SNE (C++, Matlab, Python, Torch, and R wrappers; see here) | All platforms / Github |
| Barnes-Hut t-SNE in Rust (by Francesco Iannelli) | Github |
| MNIST Dataset | Matlab file |
Examples
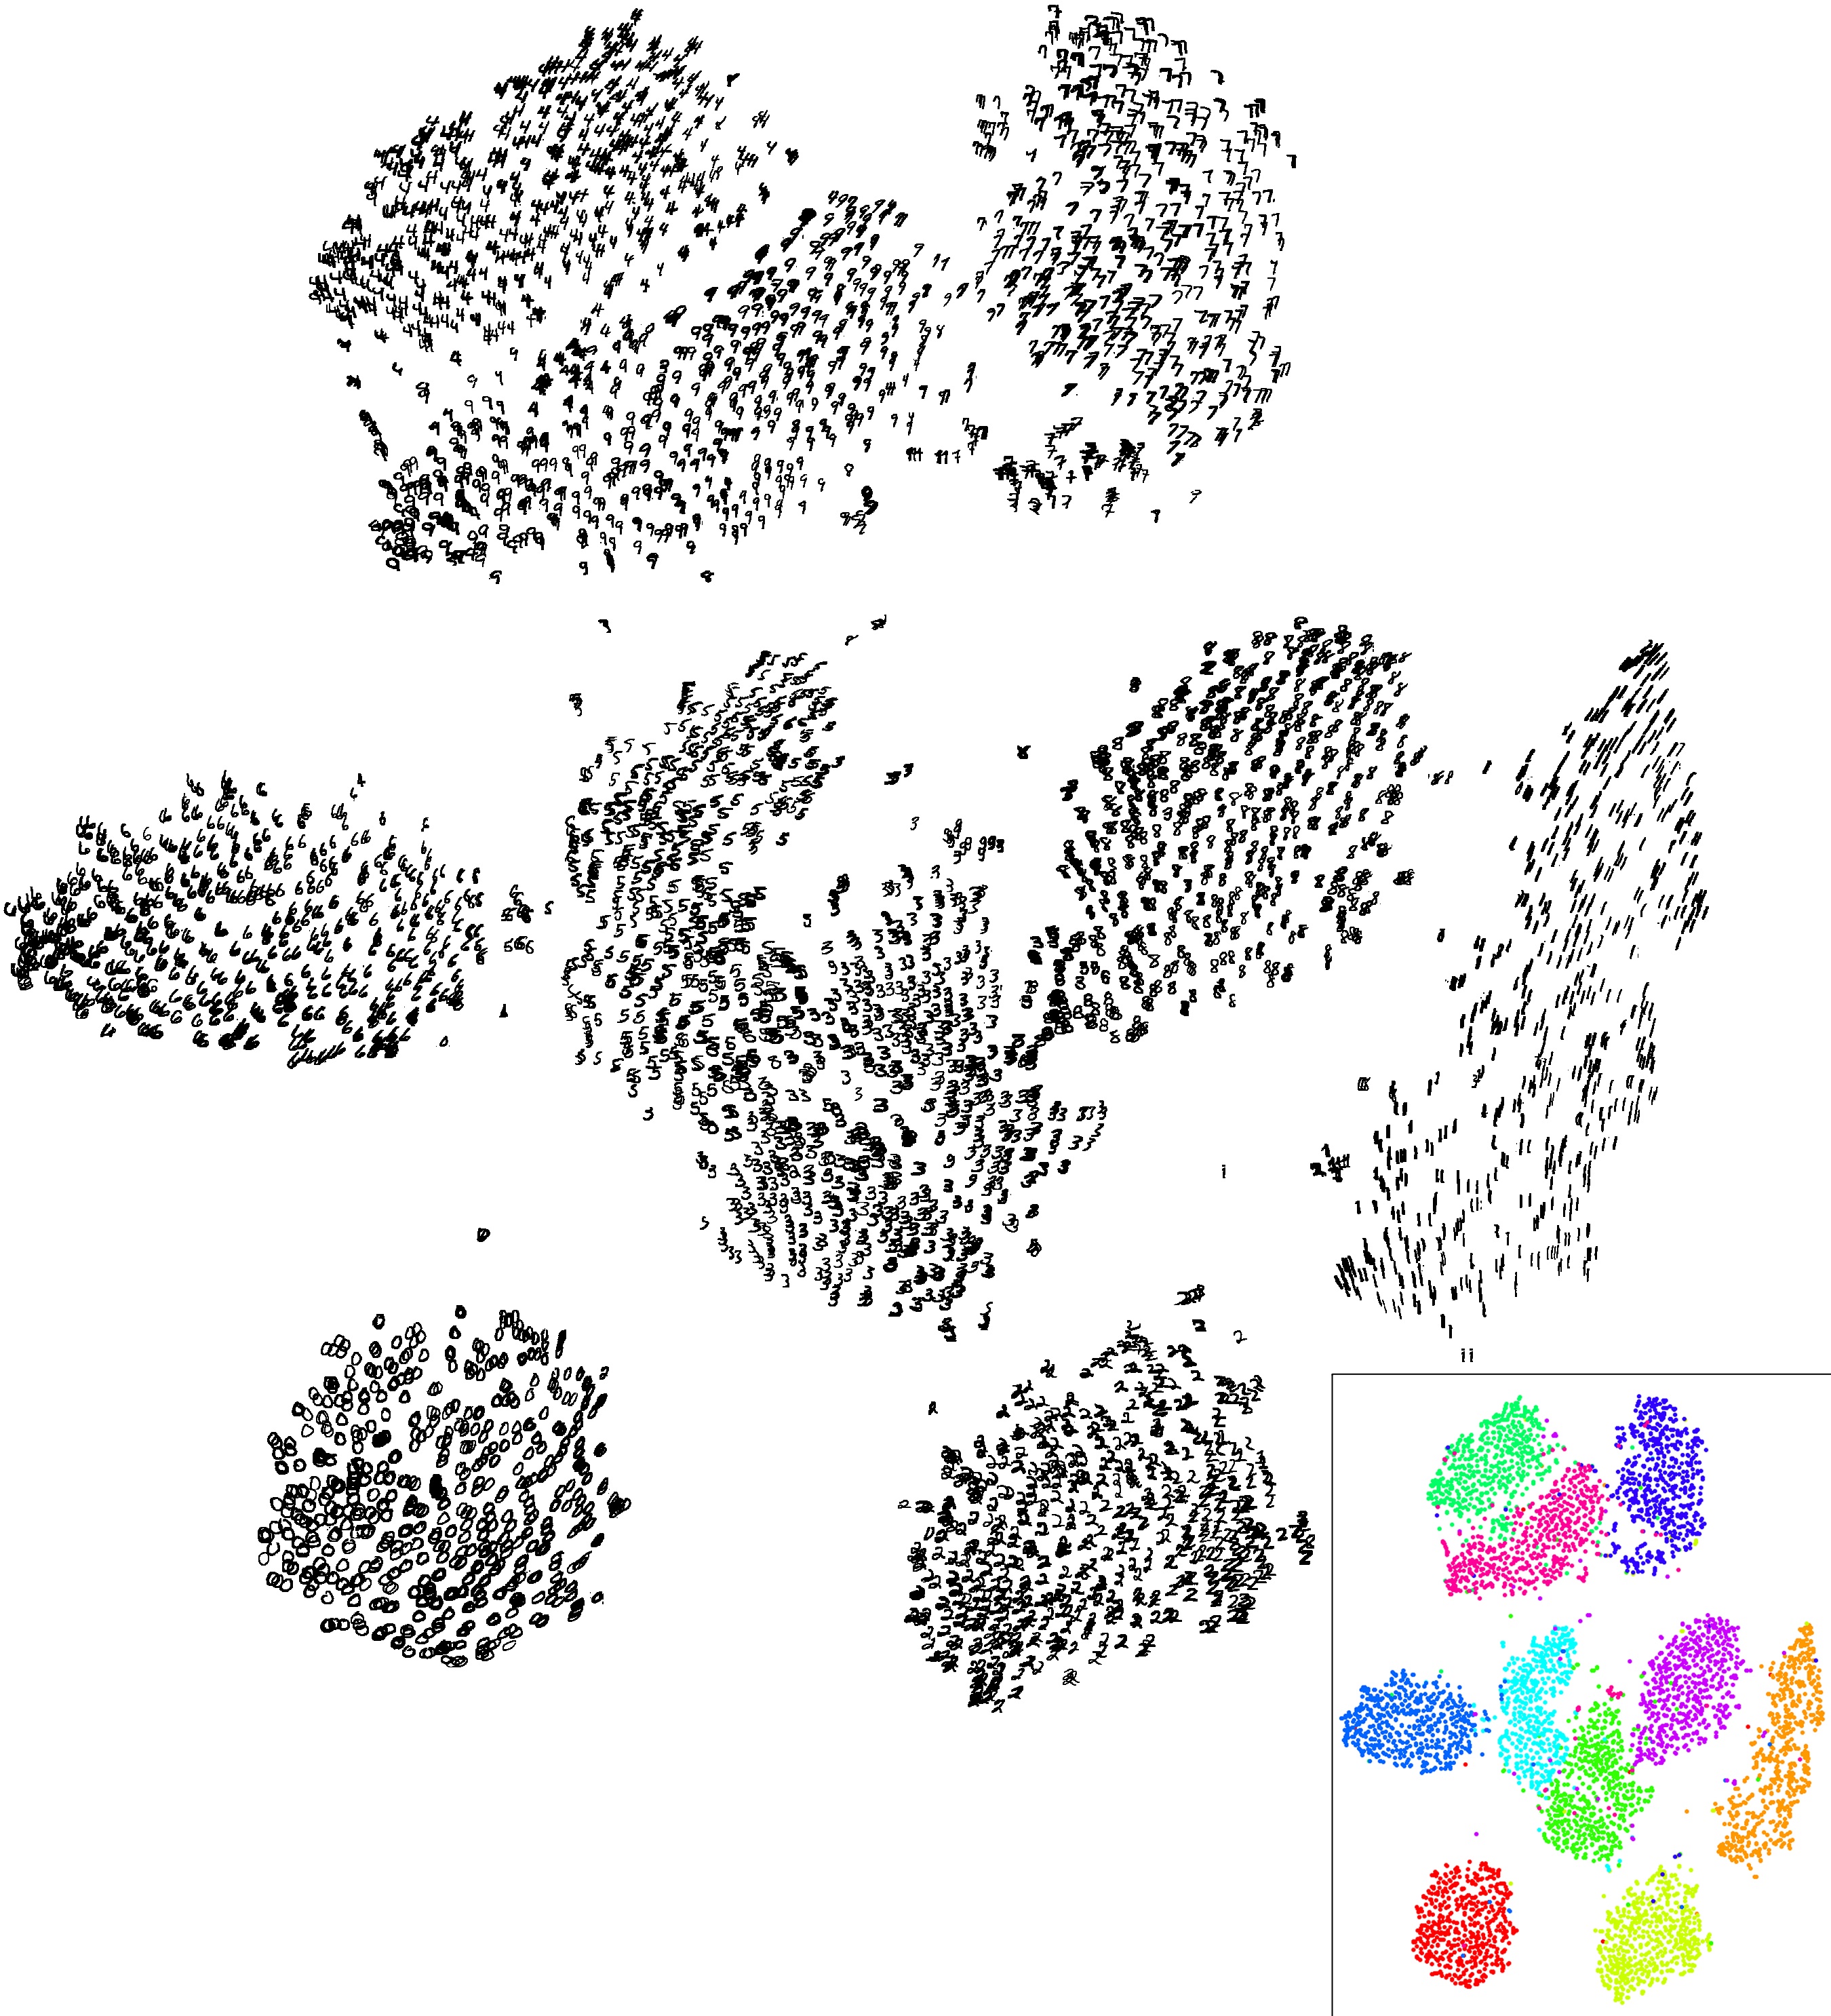
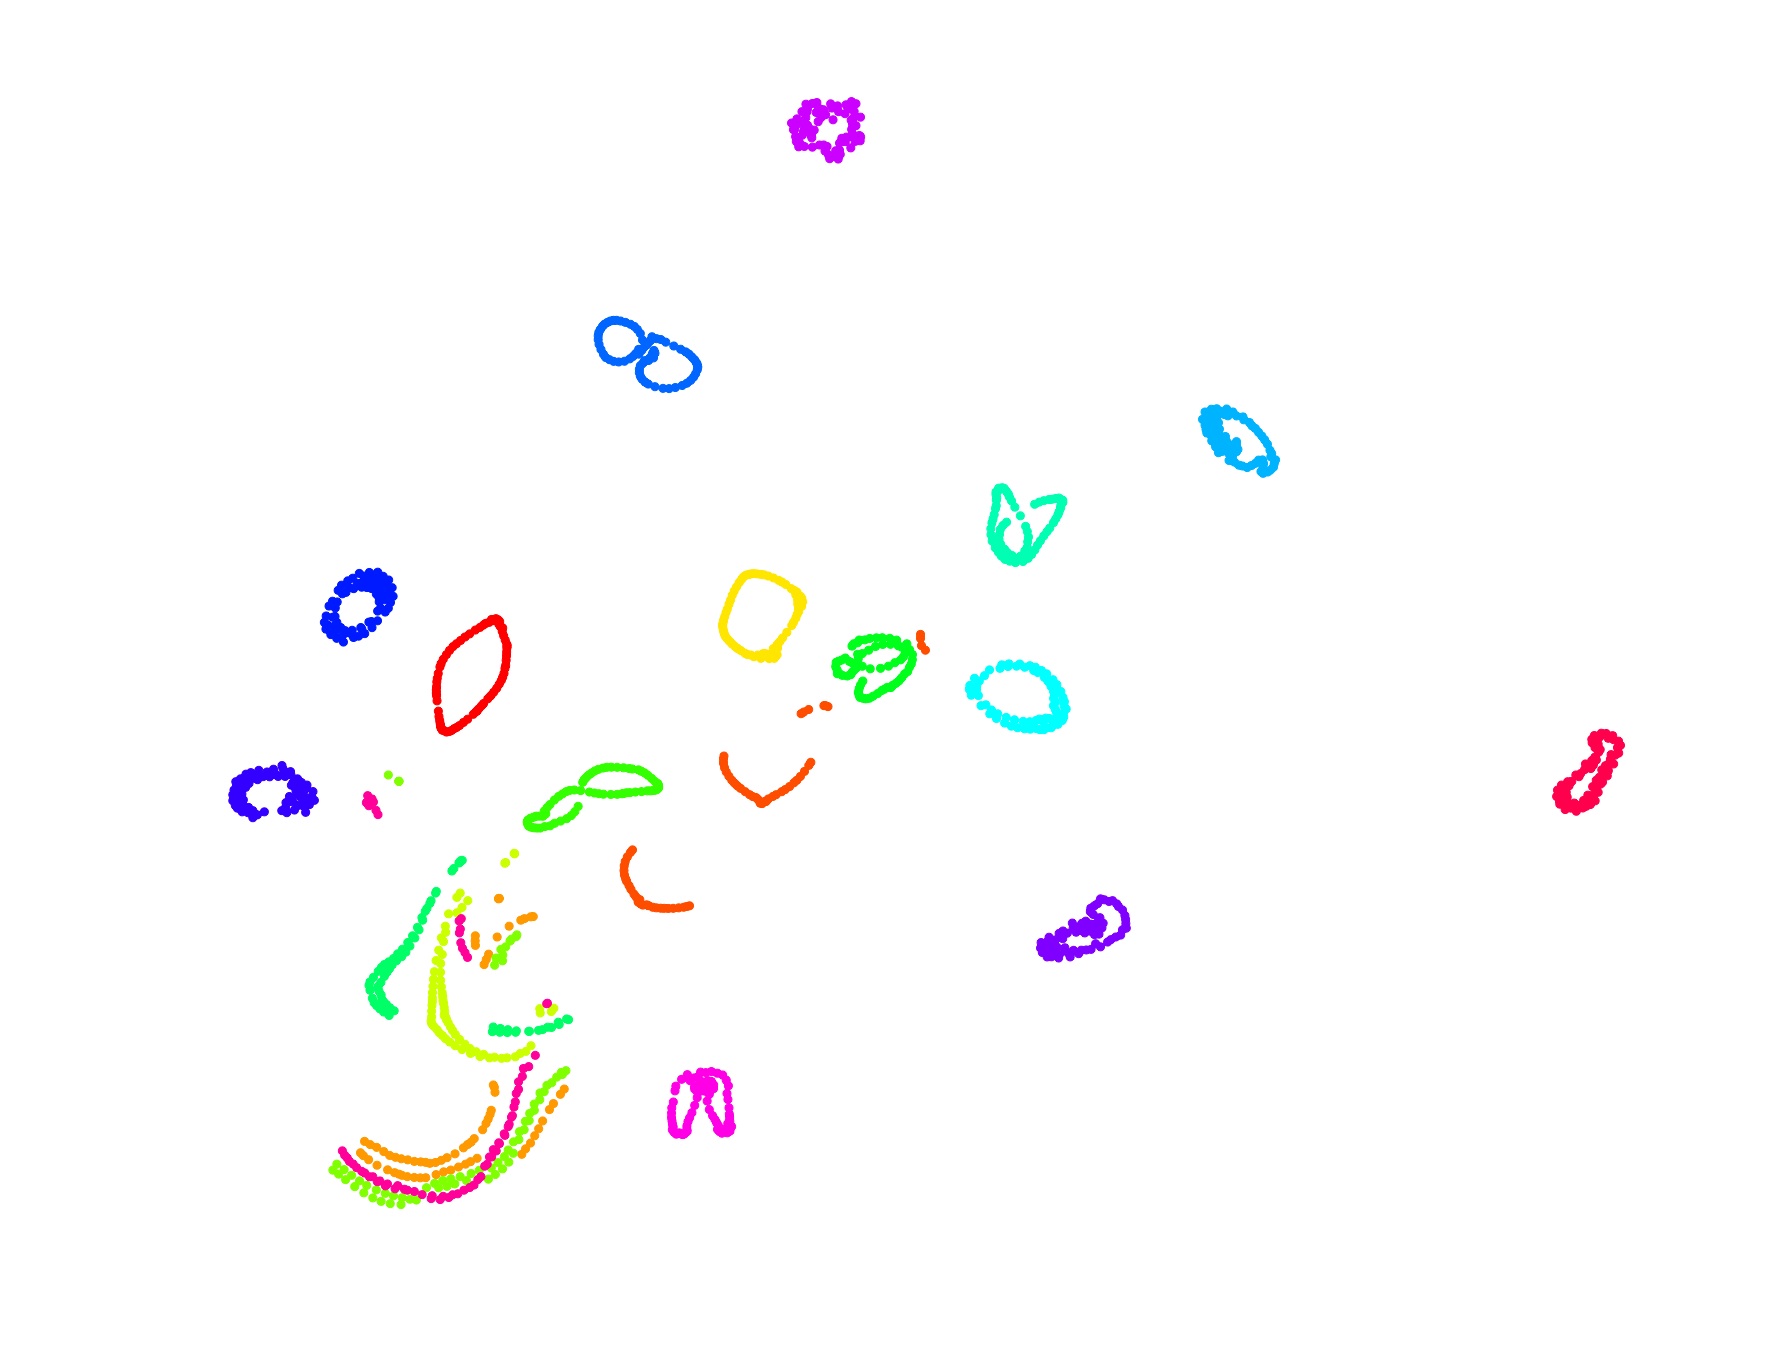
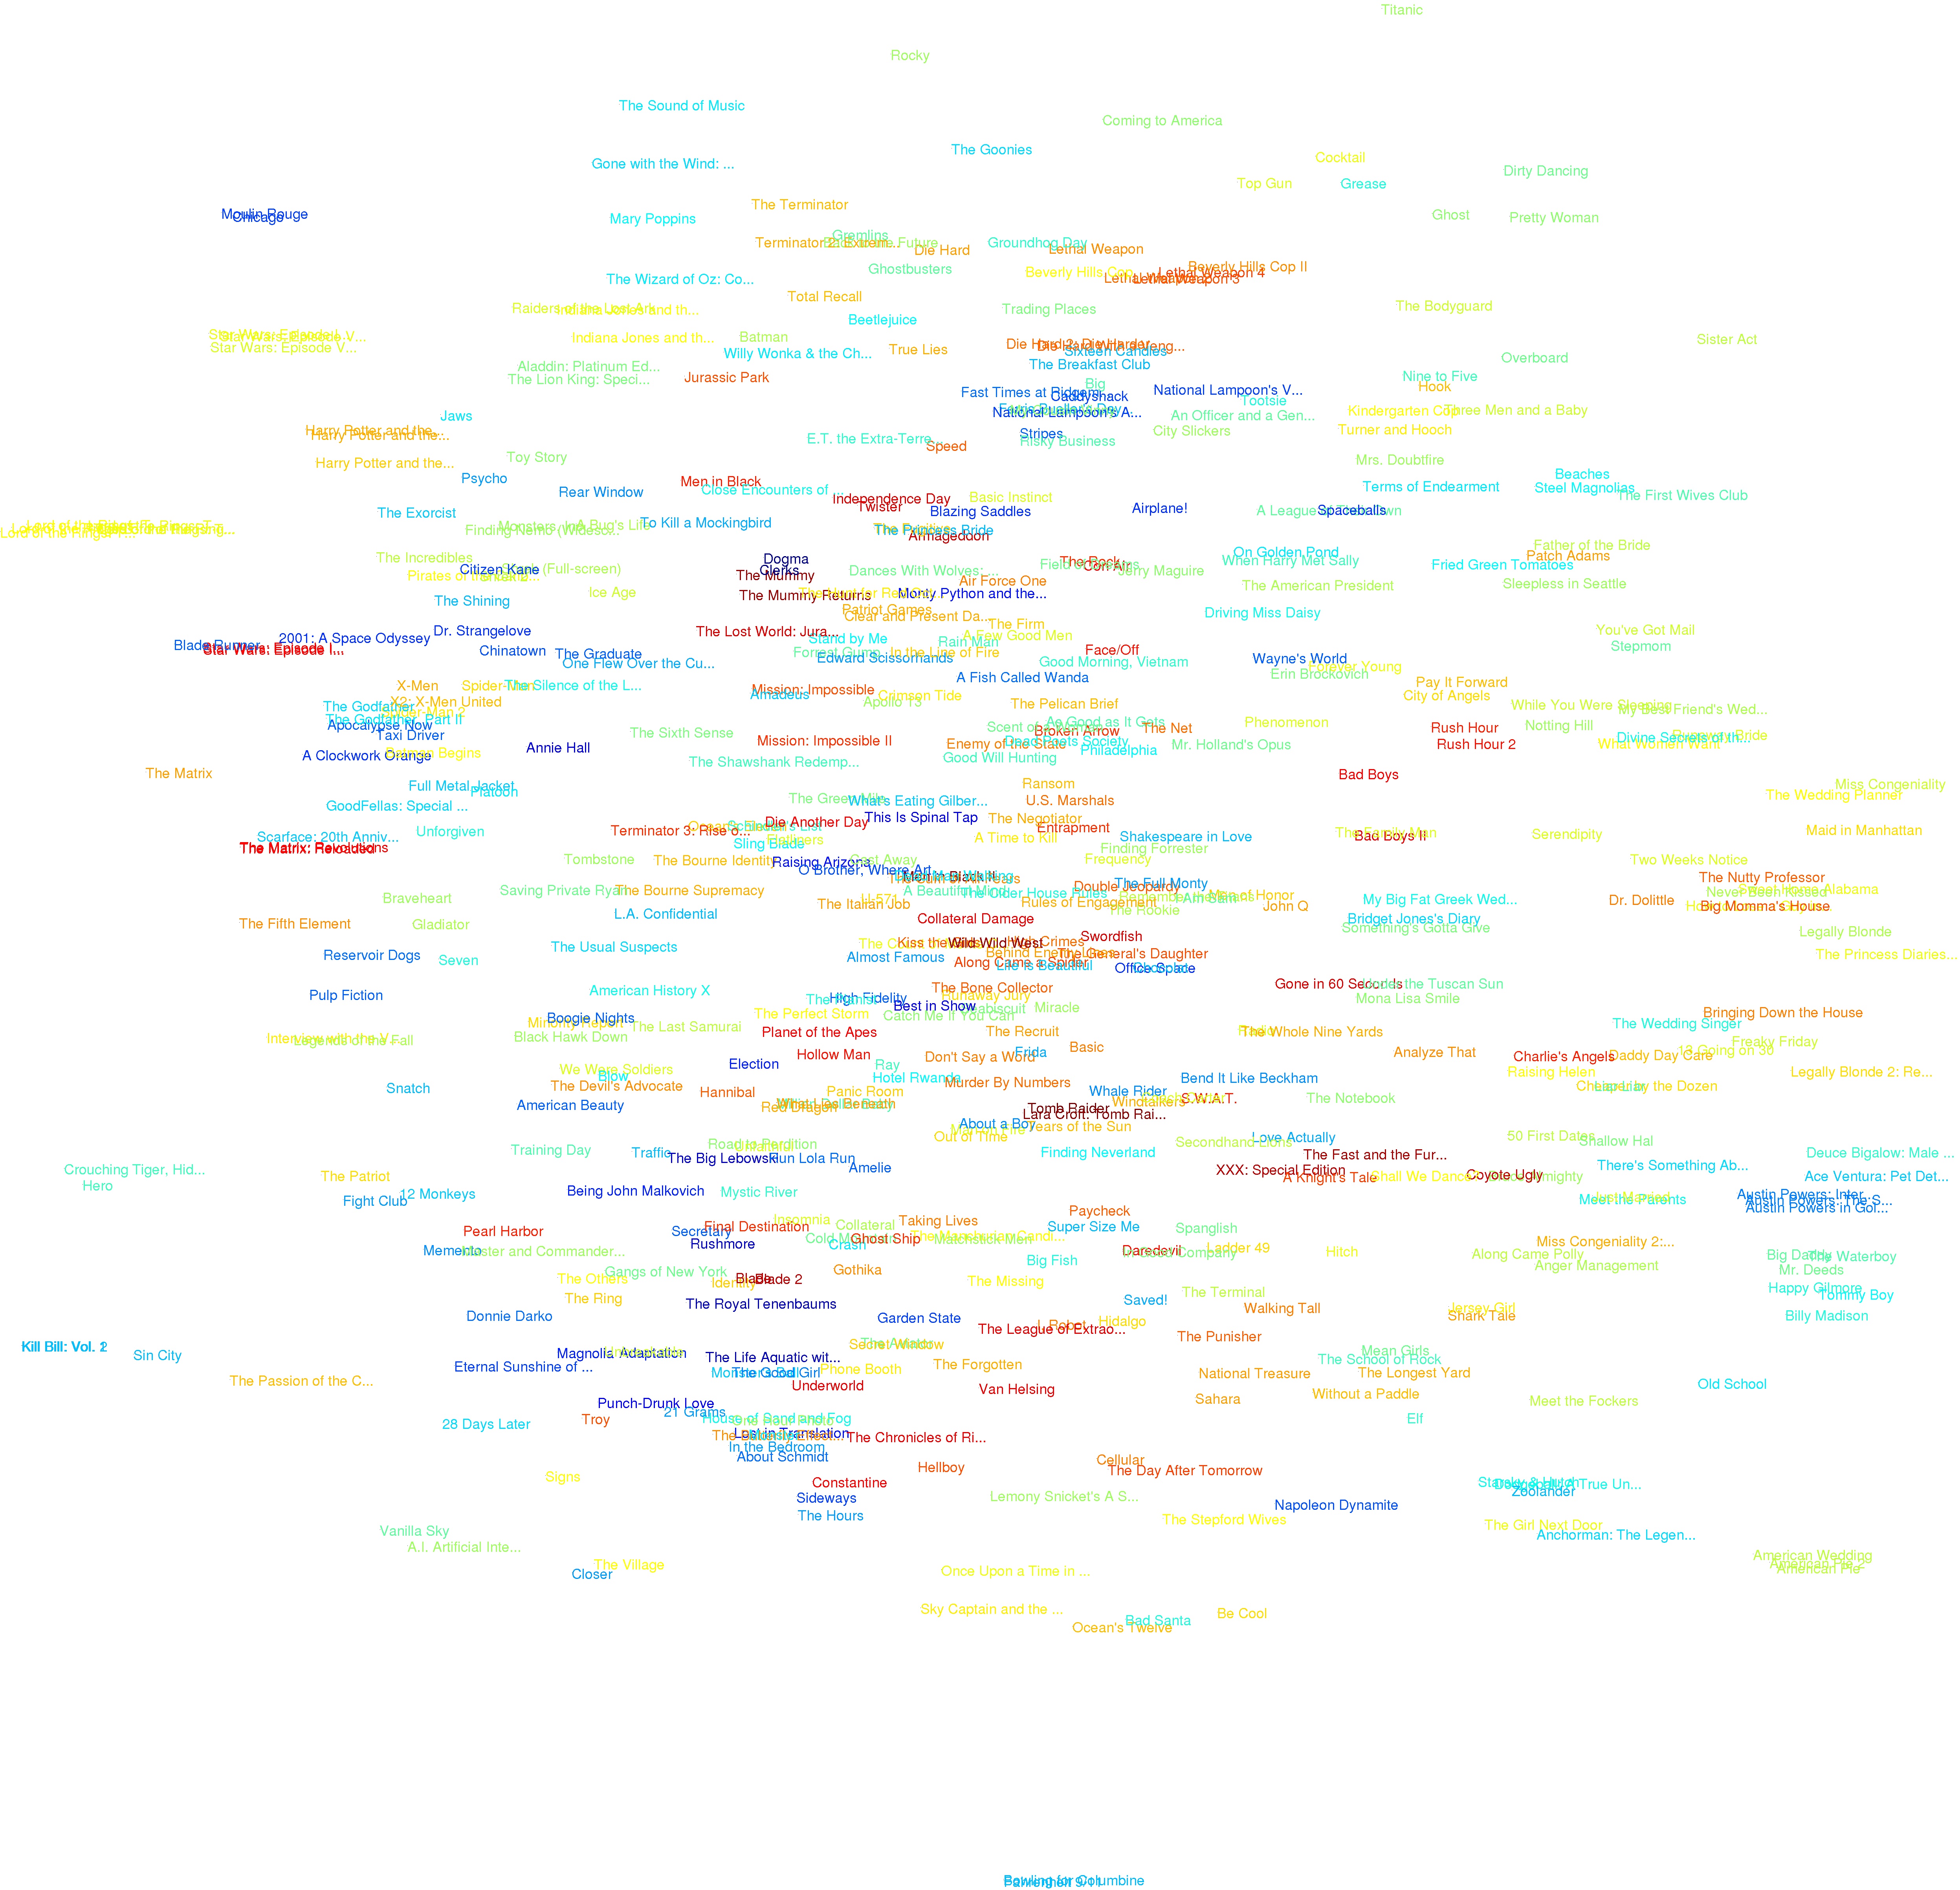
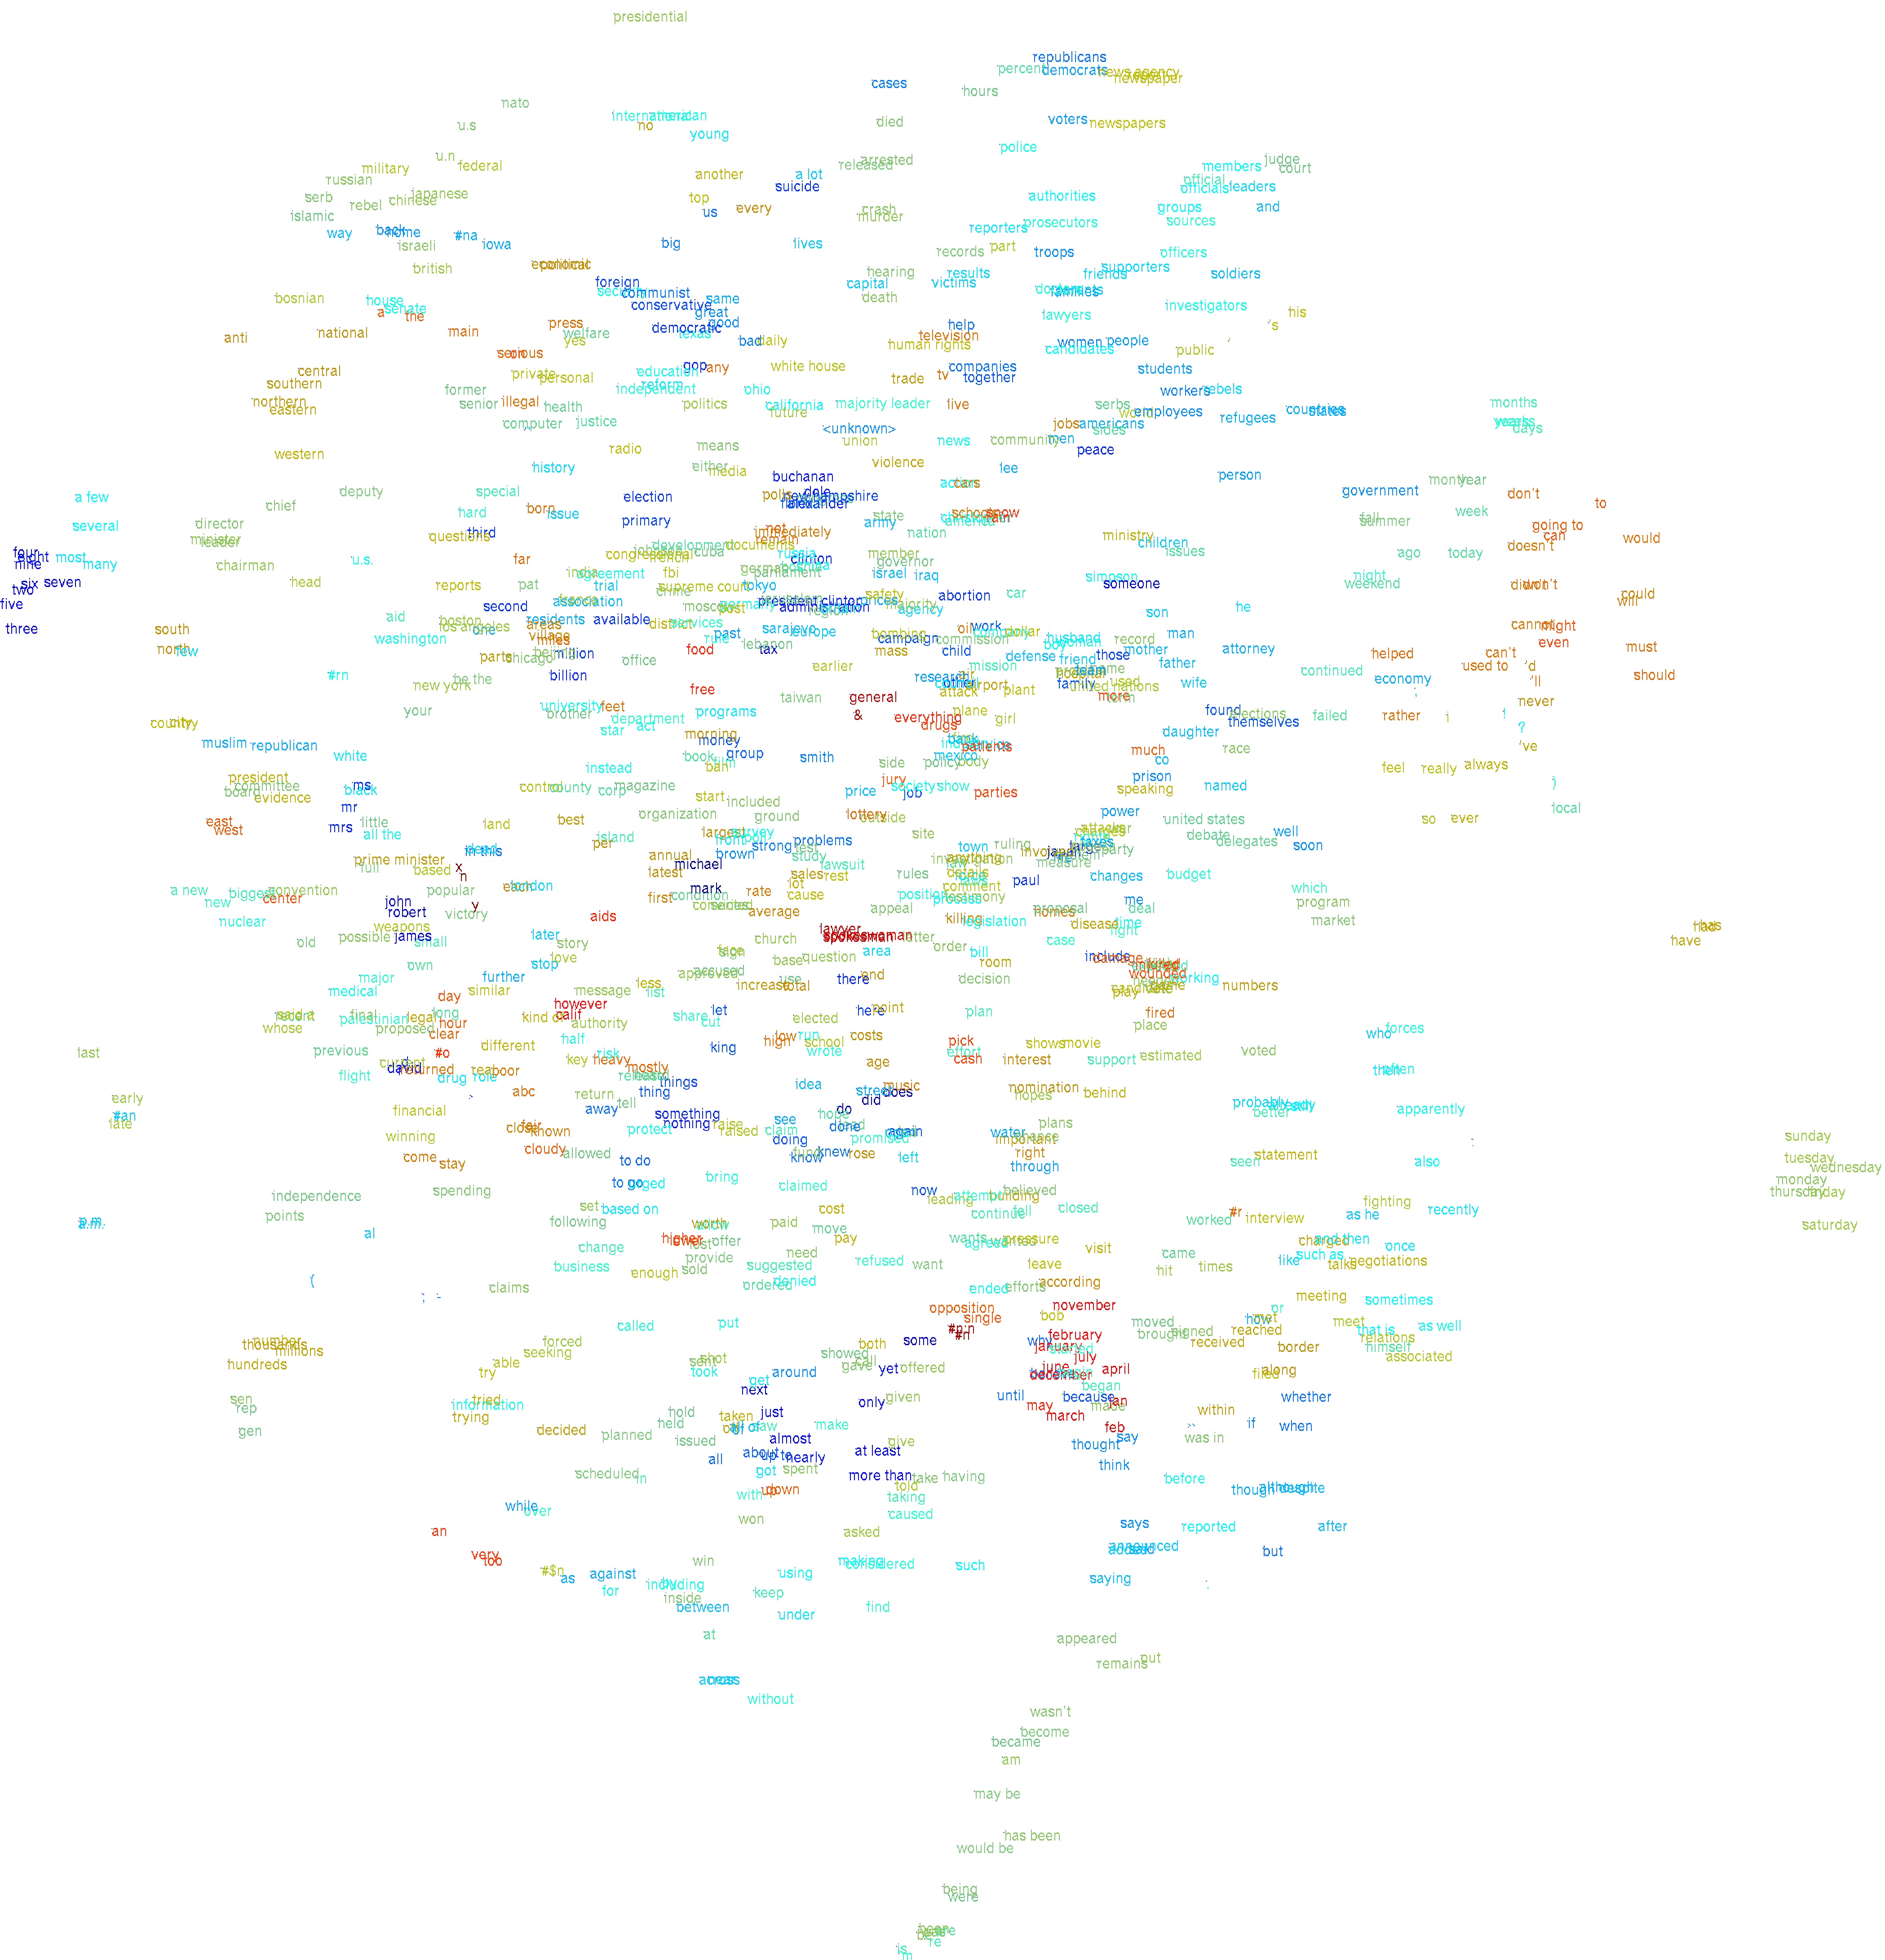
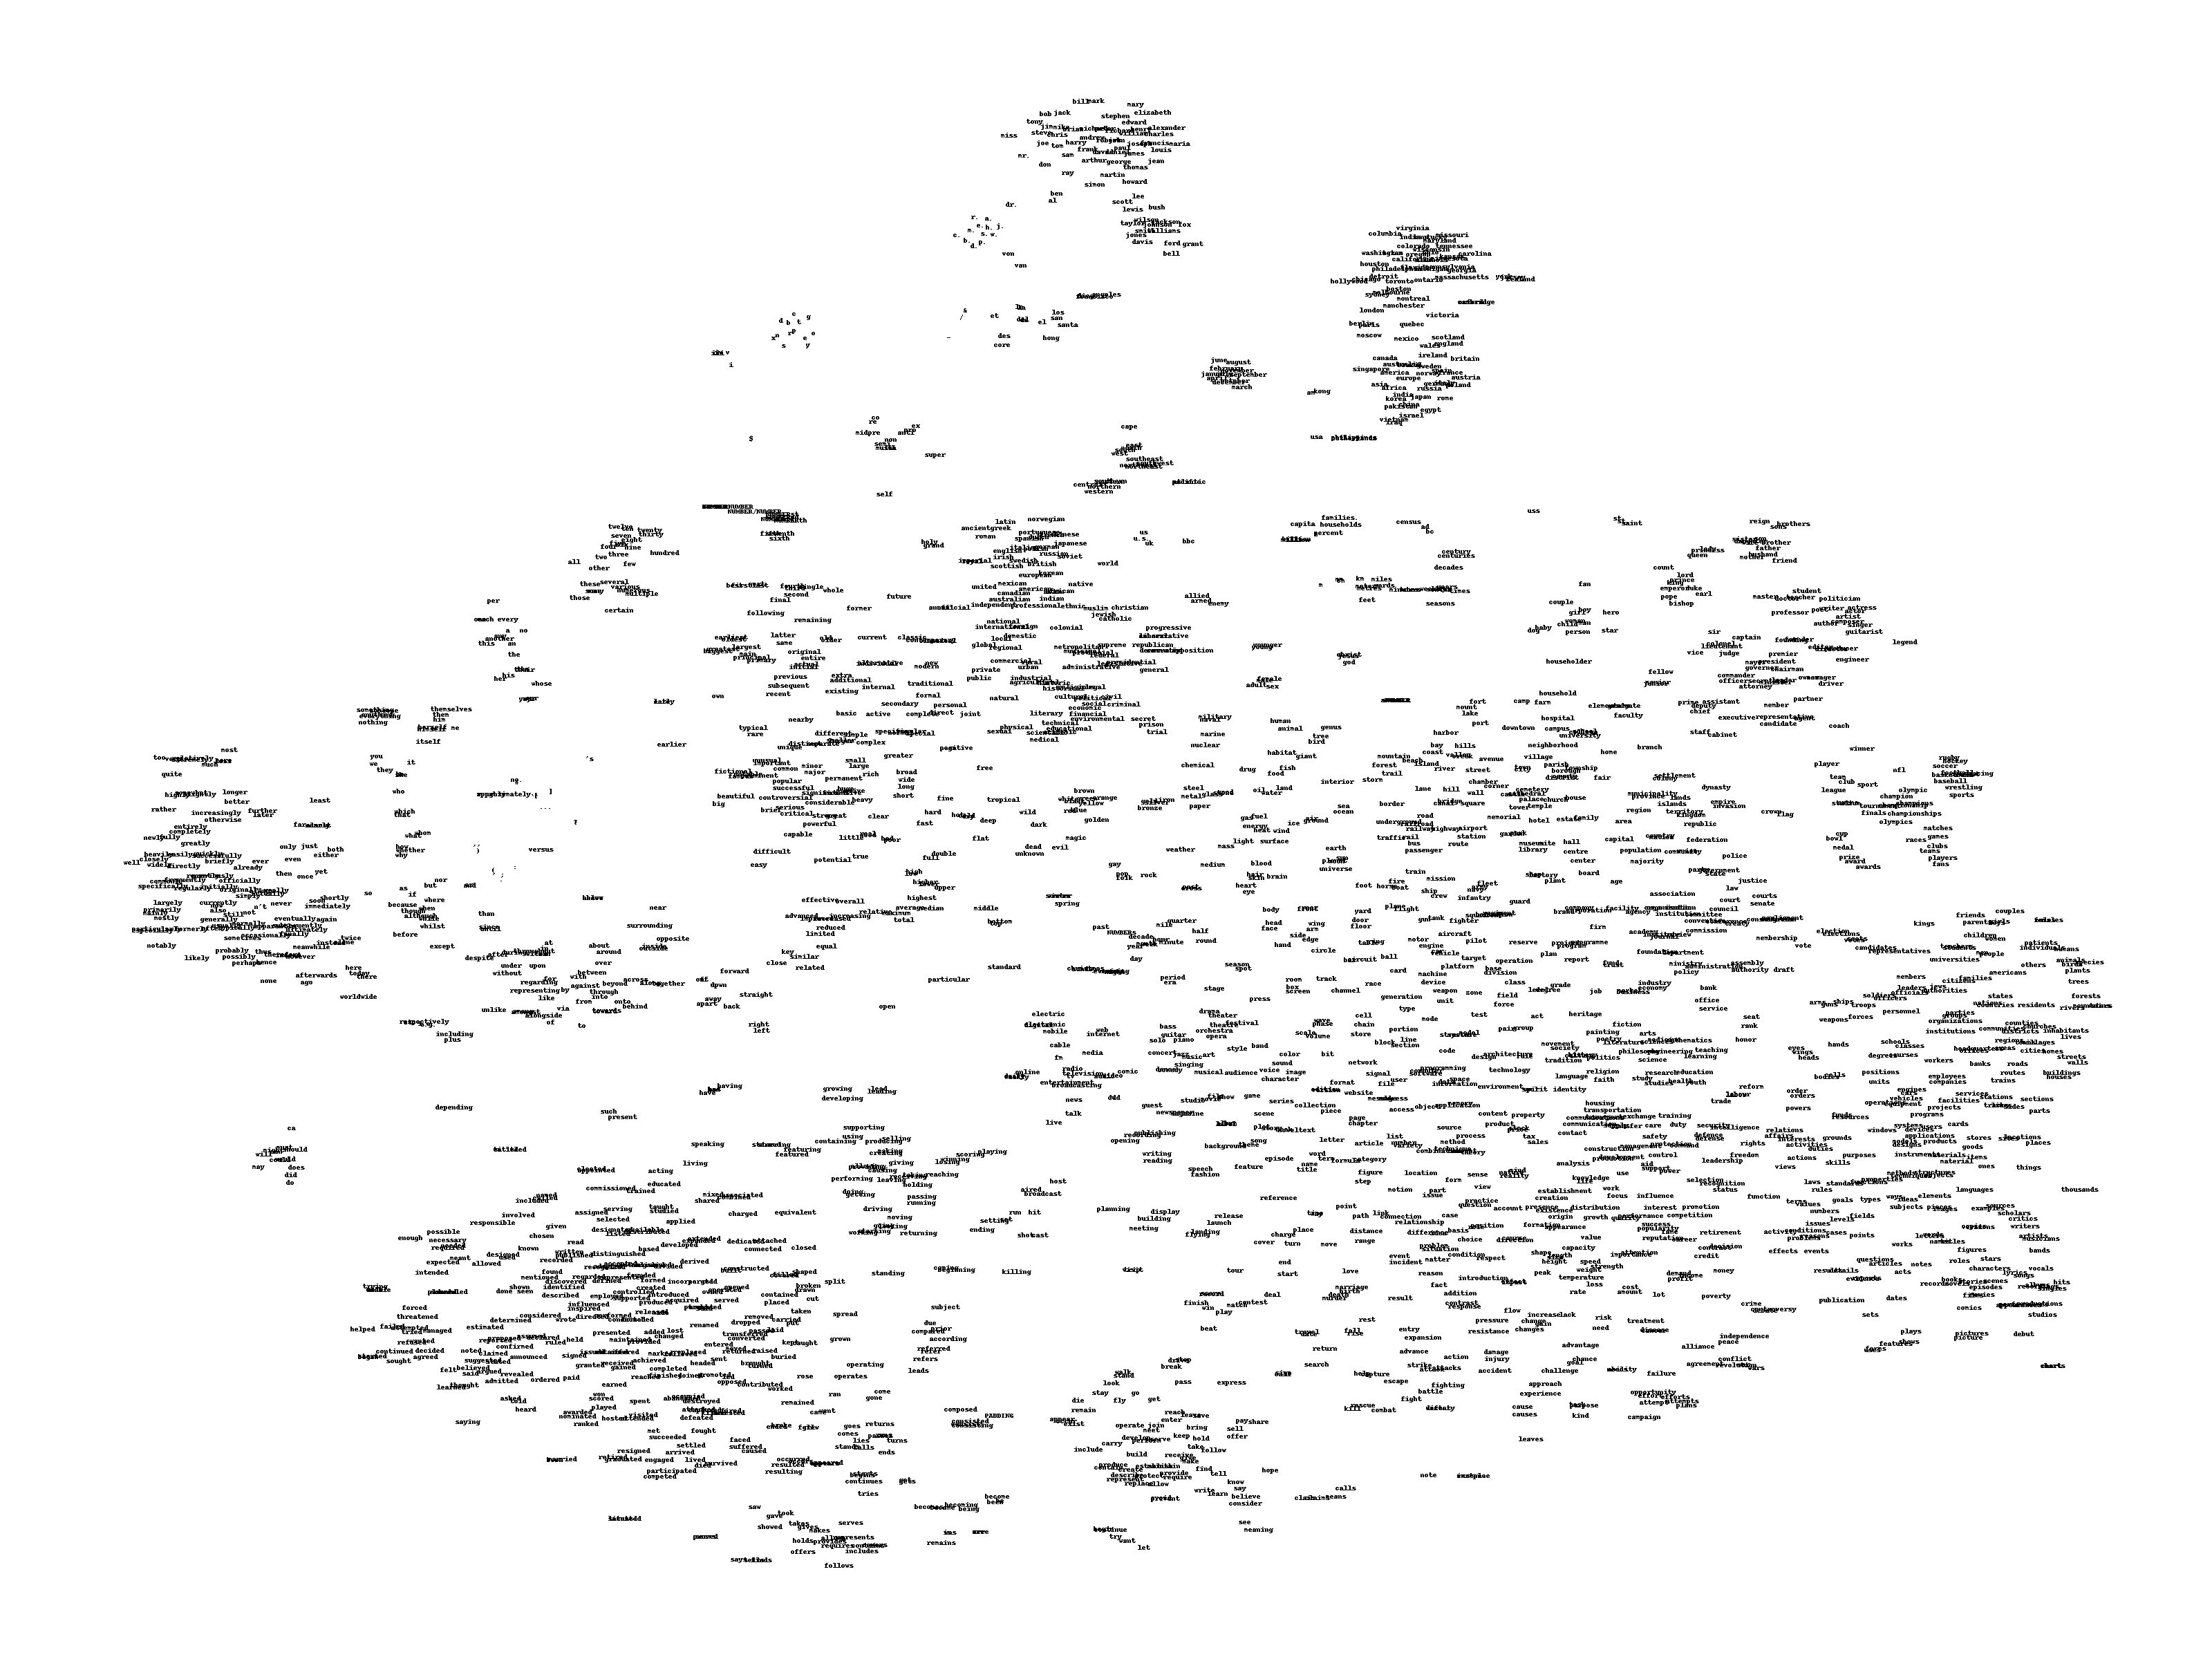
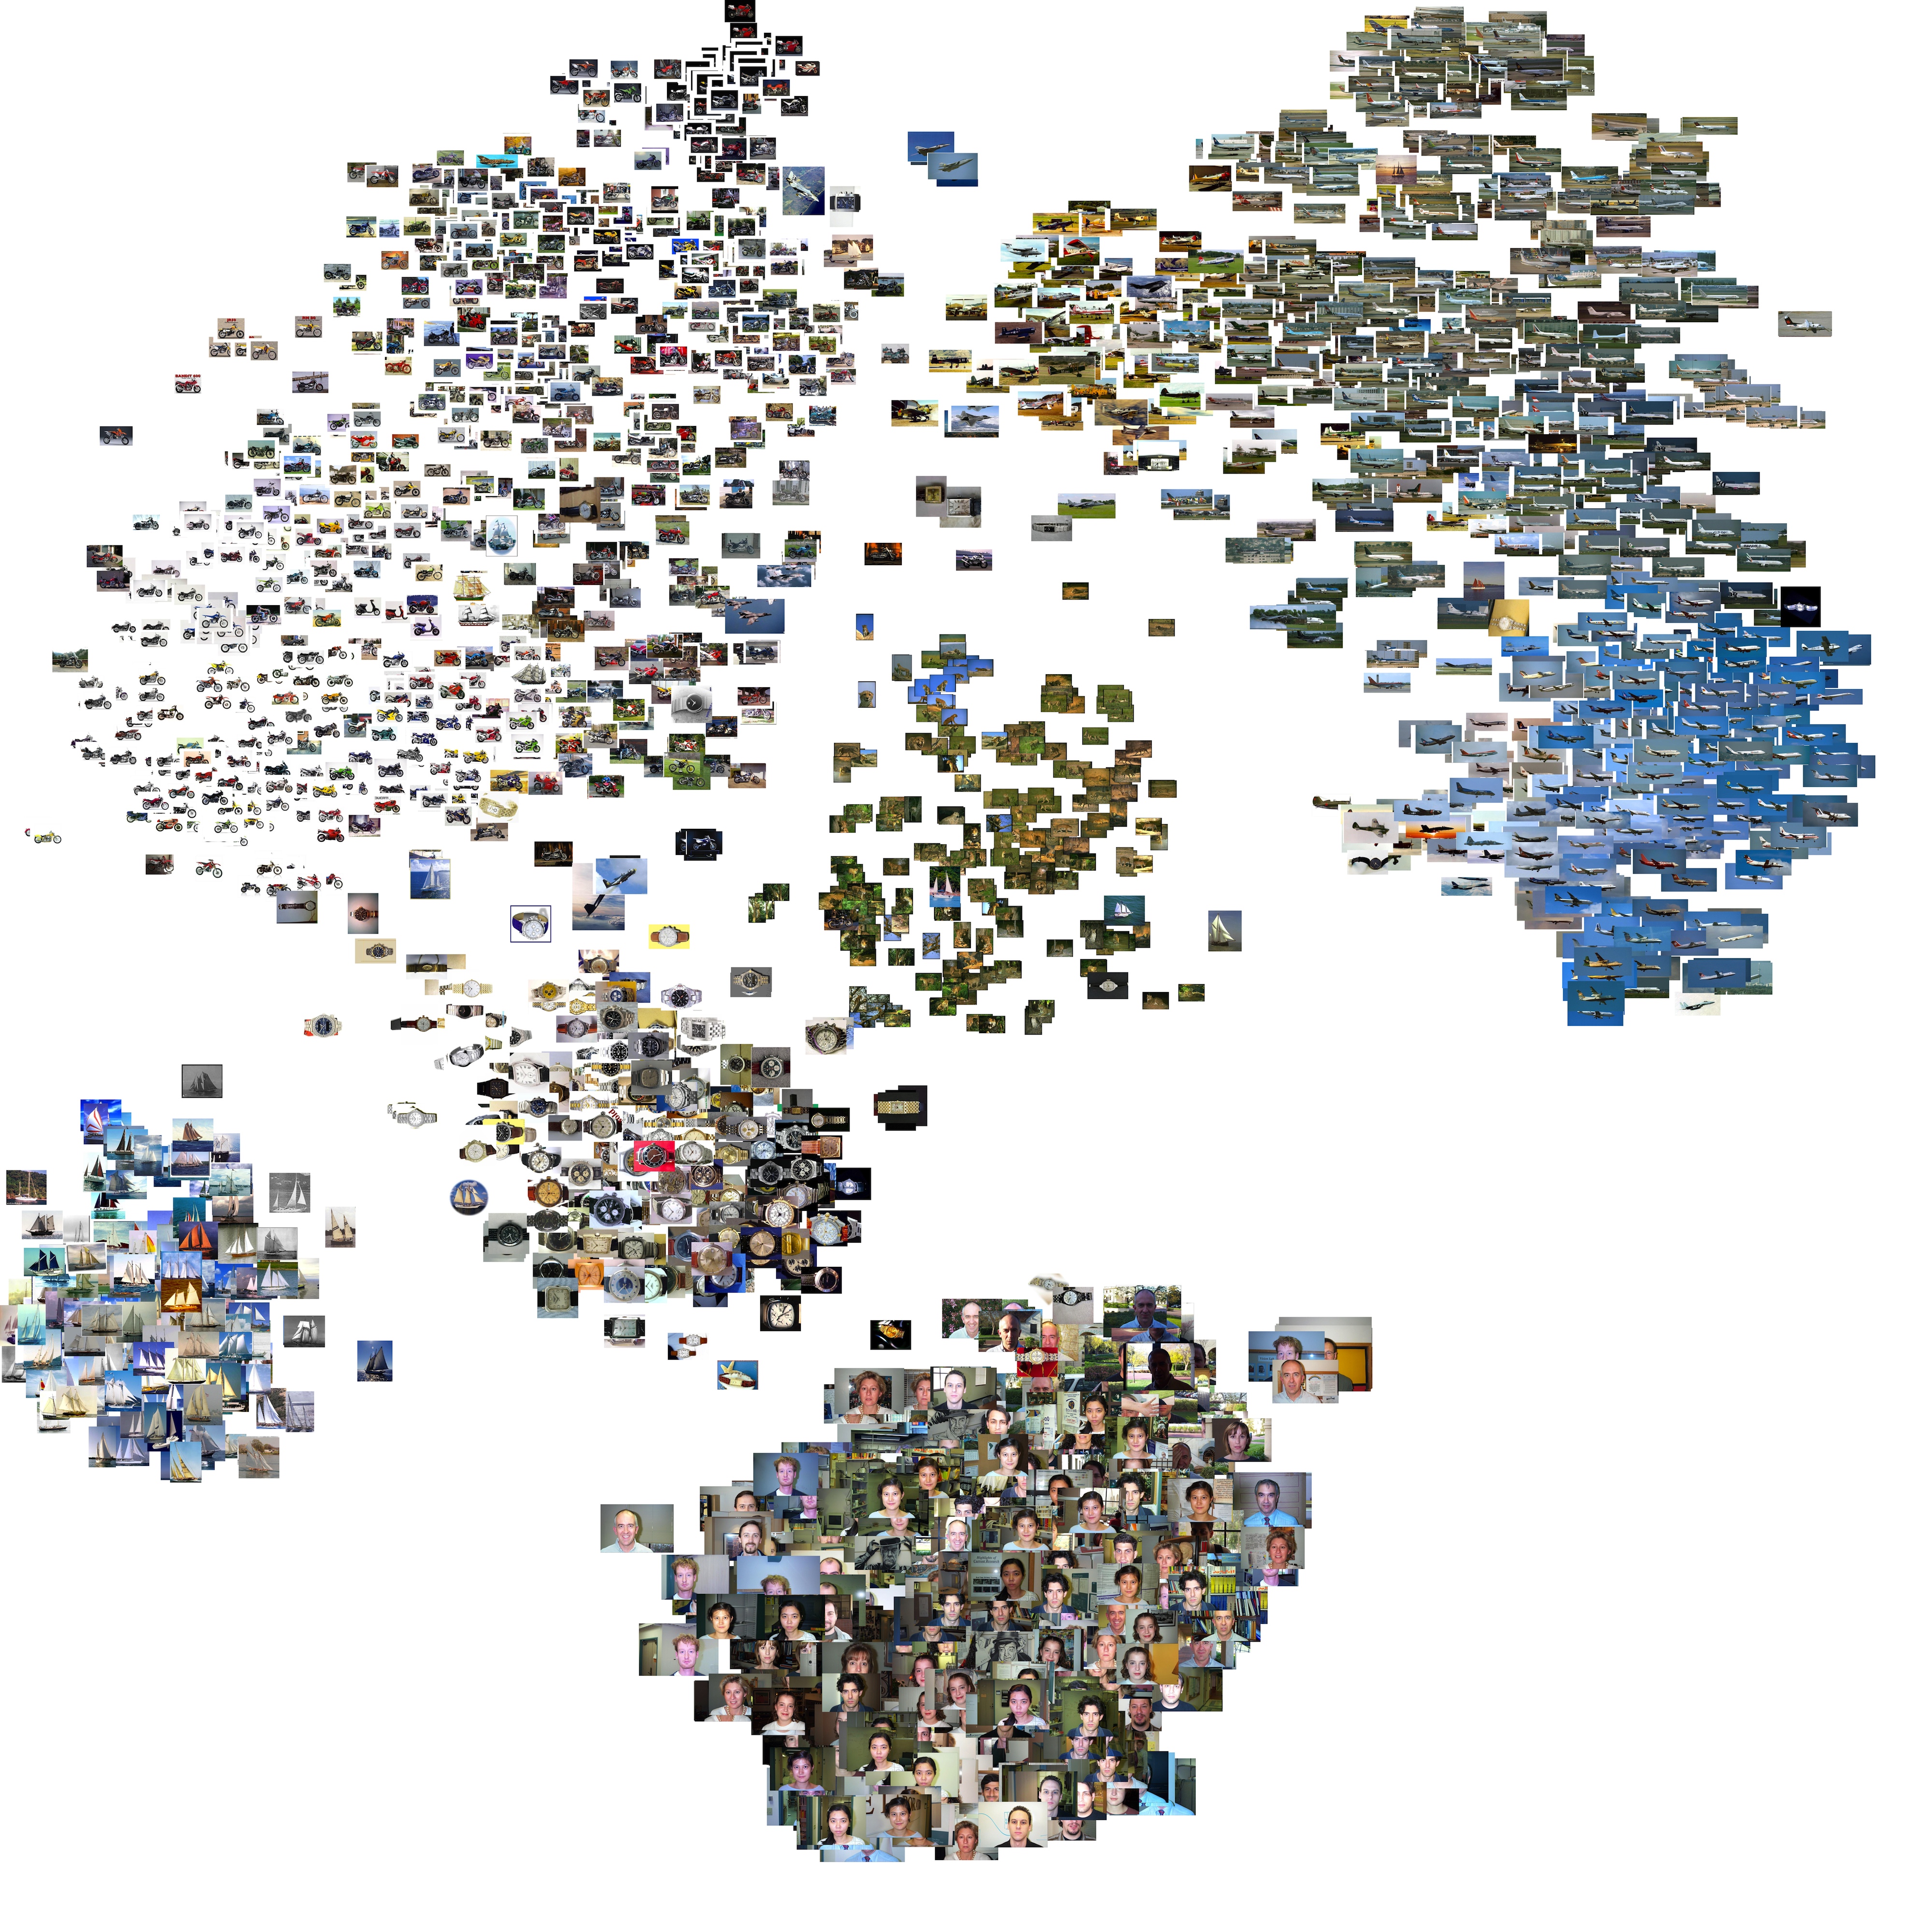
Some results of our experiments with t-SNE are available for download below. In the plots of the Netflix dataset and the words dataset, the third dimension is encoded by means of a color encoding (similar words/movies are close together and have the same color). Most of the ‘errors’ in the embeddings (such as in the 20 newsgroups) are actually due to ‘errors’ in the features t-SNE was applied on. In many of these examples, the embeddings have a 1-NN error that is comparable to that of the original high-dimensional features.
| MNIST dataset (in 2D) | JPG |
| MNIST dataset (in 3D) | MOV |
| Olivetti faces dataset (in 2D) | JPG |
| COIL-20 dataset (in 2D) | JPG |
| Netflix dataset (in 3D) on Russ’s RBM features | JPG |
| Words dataset (in 3D) on Andriy’s semantic features | JPG |
| 20 Newsgroups dataset (in 2D) on Simon’s discLDA features | JPG |
| Reuters dataset (in 2D) landmark t-SNE using semantic hashing | JPG |
| NIPS dataset (in 2D) on co-authorship data (1988-2003) | JPG |
| NORB dataset (in 2D) by Vinod | JPG |
| Words (in 2D) by Joseph on features learned by Ronan and Jason | PNG |
| CalTech-101 on SIFT bag-of-words features | JPG |
| S&P 500 by Steve on information about daily returns on company stock | PNG |
| Interactive map of scientific journals on data by Nees-Jan and Ludo, using VOSviewer | Java 1.6 |
| Relation between World Economic Forum councils | Link |
| ImageNet by Andrej on Caffe convolutional net features | Link |
| Multiple maps visualizations | Link |
| Allen Brain data | Link |
You may right-click on the images and select “Show image in new tab” to see a larger version of each of the images.
You may also be interested in these blog posts describing applications of t-SNE by Andrej Karpathy, Paul Mineiro, Alexander Fabisch, Justin Donaldson, Henry Tan, and Cyrille Rossant.
FAQ
I can’t figure out the file format for the binary implementations of t-SNE?
The format is described in the User’s guide. You also might want to have a look at the Matlab or Python wrapper code: it has code that writes the data-file and reads the results-file that can be ported fairly easily to other languages. Please note that the file format is binary (so don’t try to write or read text!), and that it does not contain any spaces, separators, newlines or whatsoever.
How can I asses the quality of the visualizations that t-SNE constructed?
Preferably, just look at them! Notice that t-SNE does not retain distances but probabilities, so measuring some error between the Euclidean distances in high-D and low-D is useless. However, if you use the same data and perplexity, you can compare the Kullback-Leibler divergences that t-SNE reports. It is perfectly fine to run t-SNE ten times, and select the solution with the lowest KL divergence.
How should I set the perplexity in t-SNE?
The performance of t-SNE is fairly robust under different settings of the perplexity. The most appropriate value depends on the density of your data. Loosely speaking, one could say that a larger / denser dataset requires a larger perplexity. Typical values for the perplexity range between 5 and 50.
What is perplexity anyway?
Perplexity is a measure for information that is defined as 2 to the power of the Shannon entropy. The perplexity of a fair die with k sides is equal to k. In t-SNE, the perplexity may be viewed as a knob that sets the number of effective nearest neighbors. It is comparable with the number of nearest neighbors k that is employed in many manifold learners.
Every time I run t-SNE, I get a (slightly) different result?
In contrast to, e.g., PCA, t-SNE has a non-convex objective function. The objective function is minimized using a gradient descent optimization that is initiated randomly. As a result, it is possible that different runs give you different solutions. Notice that it is perfectly fine to run t-SNE a number of times (with the same data and parameters), and to select the visualization with the lowest value of the objective function as your final visualization.
When I run t-SNE, I get a strange ‘ball’ with uniformly distributed points?
This usually indicates you set your perplexity way too high. All points now want to be equidistant. The result you got is the closest you can get to equidistant points as is possible in two dimensions. If lowering the perplexity doesn’t help, you might have run into the problem described in the next question. Similar effects may also occur when you use highly non-metric similarities as input.
When I run t-SNE, it reports a very low error but the results look crappy?
Presumably, your data contains some very large numbers, causing the binary search for the correct perplexity to fail. In the beginning of the optimization, t-SNE then reports a minimum, mean, and maximum value for sigma of 1. This is a sign that something went wrong! Just divide your data or distances by a big number, and try again.
I tried everything you said, but t-SNE still doesn’t seem to work very well?
Maybe there is something weird in your data. As a sanity check, try running PCA on your data to reduce it to two dimensions. If this also gives bad results, then maybe there is not very much nice structure in your data in the first place. If PCA works well but t-SNE doesn’t, I am fairly sure you did something wrong. Just check your code again until you found the bug! If nothing works, feel free to drop me a line.
Can I use a pairwise Euclidean distance matrix as input into t-SNE?
Yes you can! Download the Matlab implementation, and use your pairwise Euclidean distance matrix as input into the tsne_d.m function.
Can I use a pairwise similarity matrix as input into t-SNE?
Yes you can! For instance, we successfully applied t-SNE on a dataset of word association data. Download the Matlab implementation, make sure the diagonal of the pairwise similarity matrix contains only zeros, symmetrize the pairwise similarity matrix, and normalize it to sum up to one. You can now use the result as input into the tsne_p.m function.
Can I use t-SNE to embed data in more than two dimensions?
Well, yes you can, but there is a catch. The key characteristic of t-SNE is that it solves a problem known as the crowding problem. The extent to which this problem occurs depends on the ratio between the intrinsic data dimensionality and the embedding dimensionality. So, if you embed in, say, thirty dimensions, the crowding problem is less severe than when you embed in two dimensions. As a result, it often works better if you increase the degrees of freedom of the t-distribution when embedding into thirty dimensions (or if you try to embed intrinsically very low-dimensional data such as the Swiss roll). More details about this are described in the AI-STATS paper.
Why doesn’t t-SNE work as well as LLE or Isomap on the Swiss roll data?
When embedding the Swiss roll data, the crowding problem does not apply. So you may have to use a lighter-tailed t-distribution to embed the Swiss toll successfully (see above). But frankly… who cares about Swiss rolls when you can embed complex real-world data nicely?
Once I have a t-SNE map, how can I embed incoming test points in that map?
t-SNE learns a non-parametric mapping, which means that it does not learn an explicit function that maps data from the input space to the map. Therefore, it is not possible to embed test points in an existing map (although you could re-run t-SNE on the full dataset). A potential approach to deal with this would be to train a multivariate regressor to predict the map location from the input data. Alternatively, you could also make such a regressor minimize the t-SNE loss directly, which is what I did in this paper.